 Home

Consumer Analytics
A survey results platform organized the way brands read a report.
- Role
- Lead designer
- Timeline
- Ten months
- Year
- 2022–2024
- Team
- UX researcher, design system designer
4 to 8 extra hours on every report
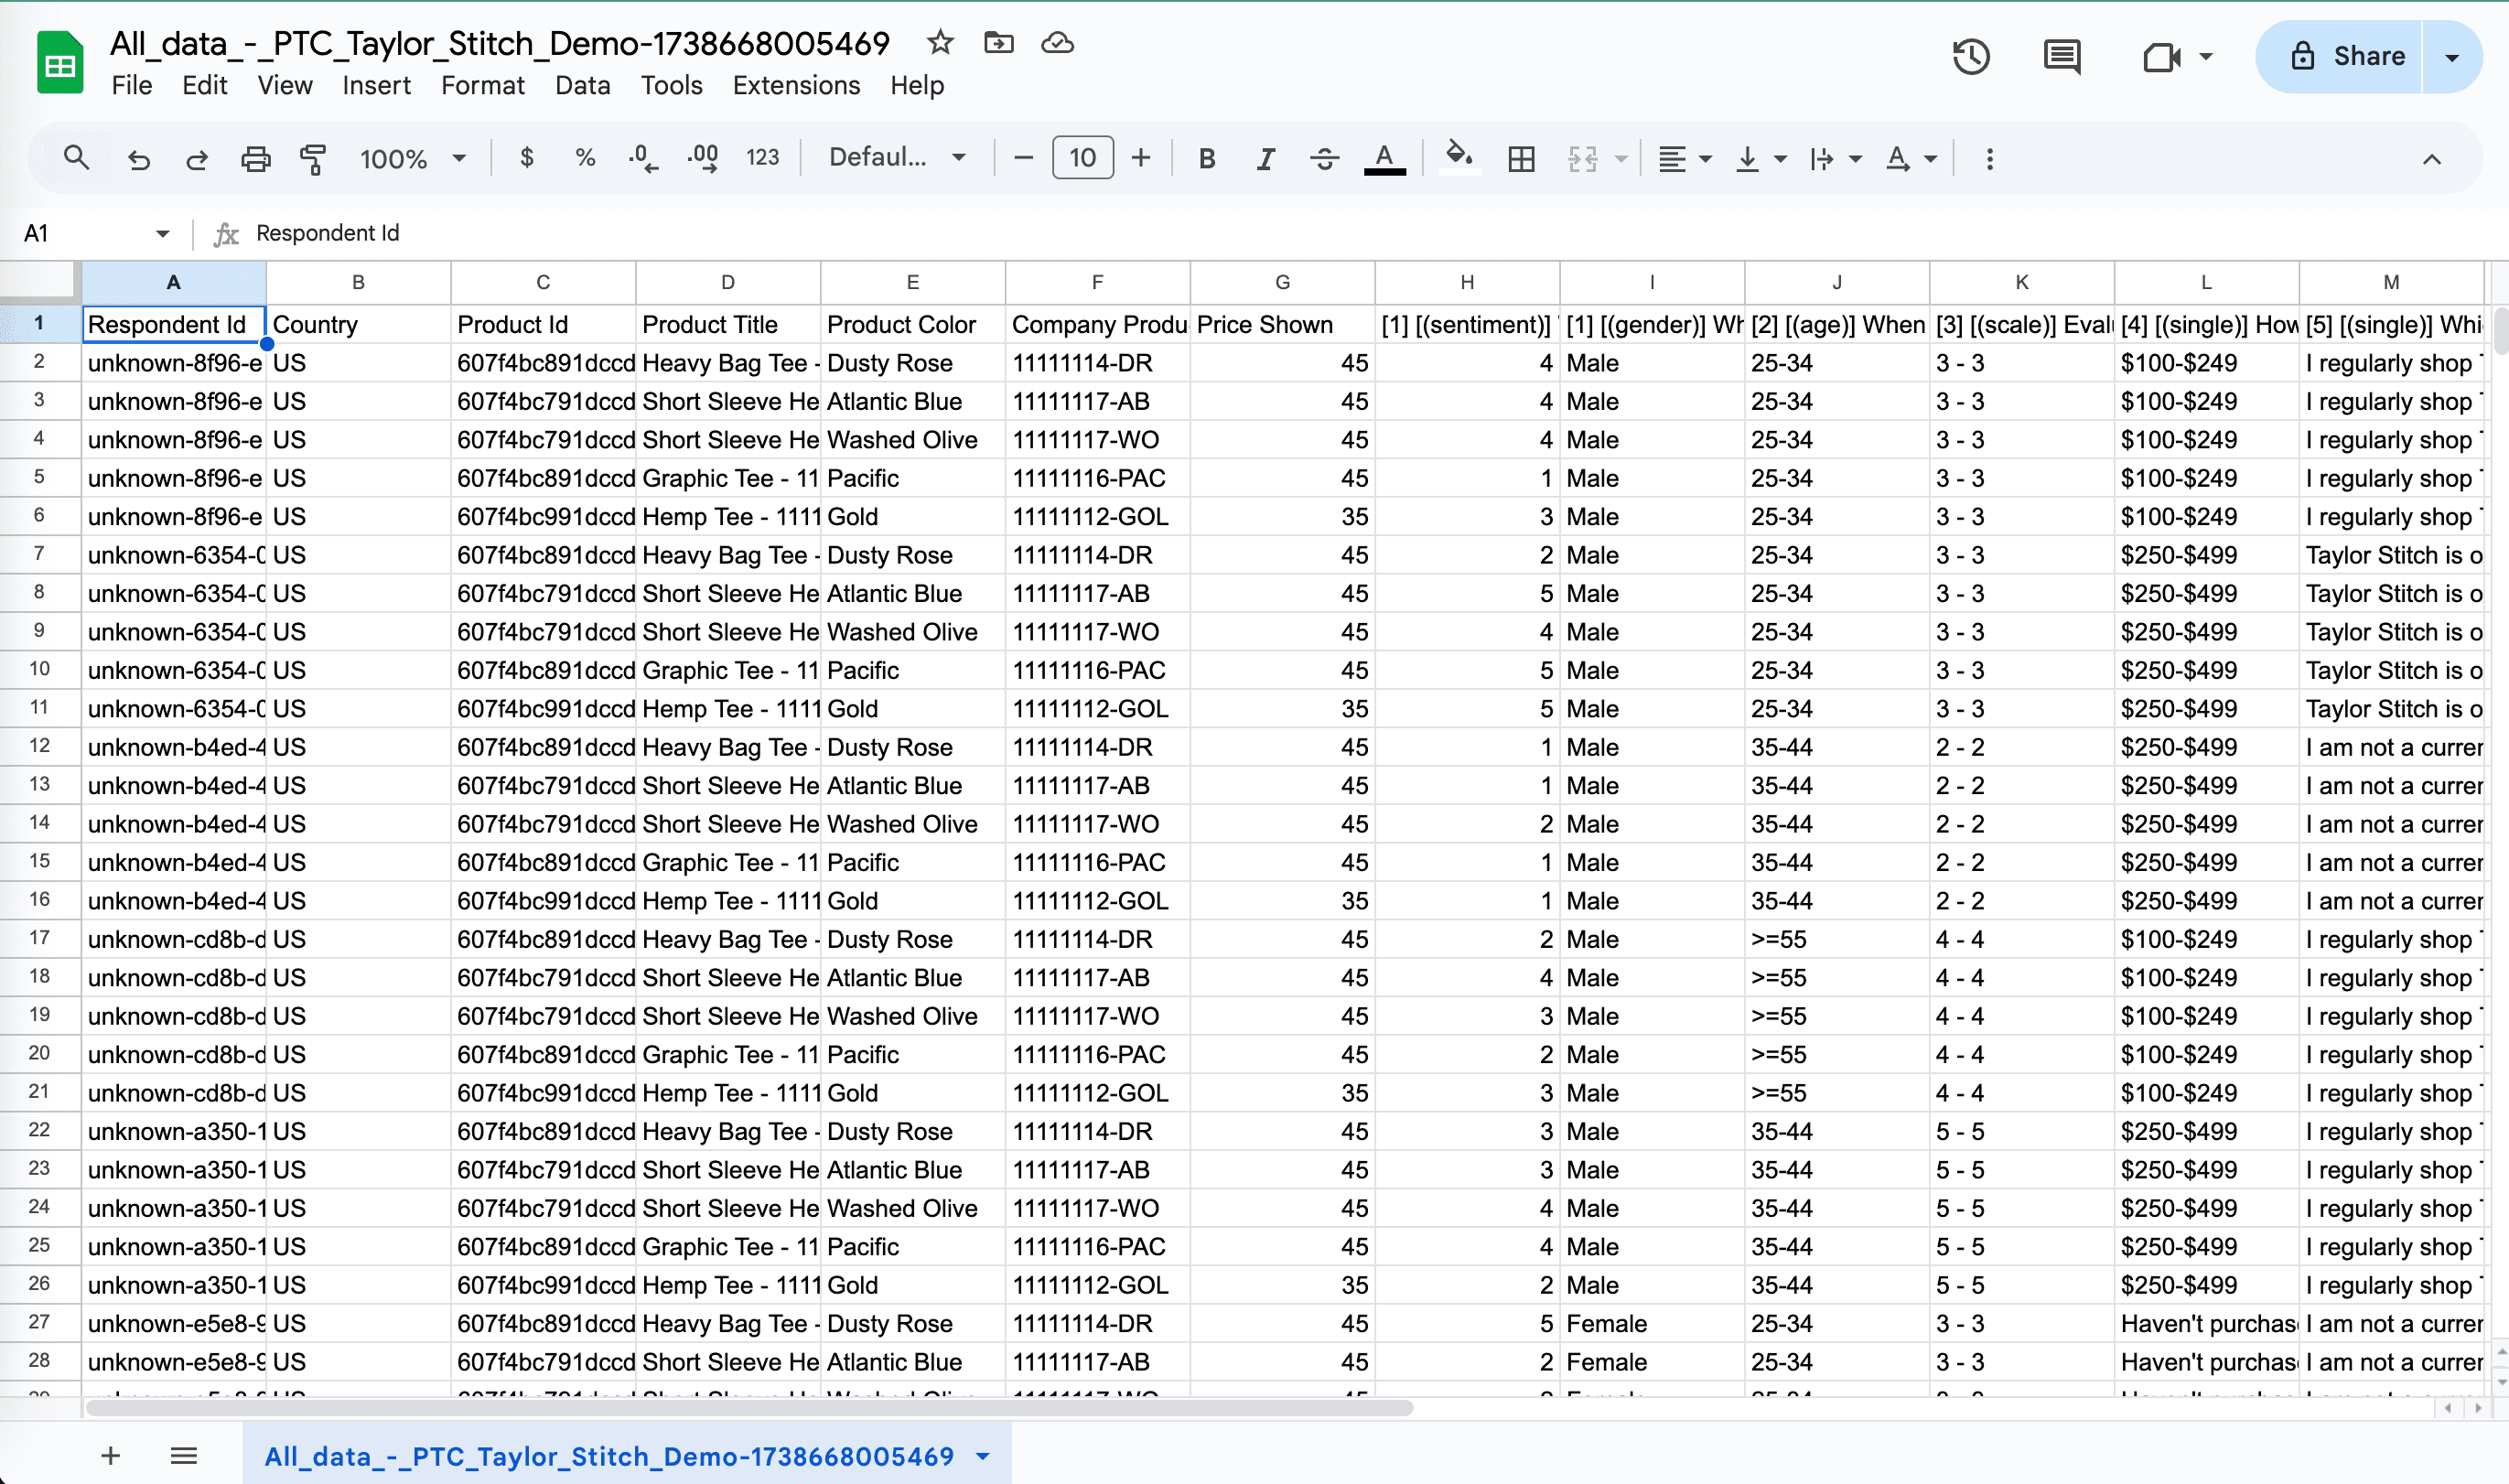
Before a report reached a brand, someone on our Customer Ops team downloaded a CSV, built pivot tables in Excel, made the charts by hand and put it all into a Google Slides deck. That added 4 to 8 hours to every project. I saw it up close by joining their weekly standups, shadowing their projects and reading hundreds of the decks they’d sent out.
MakerSights helps retail brands like Adidas, HOKA and The North Face make product decisions with consumer data. We needed to cut that manual work and move customers from version 1.0 of the results platform to 2.0.
Navigation in the way of the data
Two other groups were stuck too. Insights managers struggled to get research in front of people upstream, and merchants often ran out of time to read results before a decision closed.
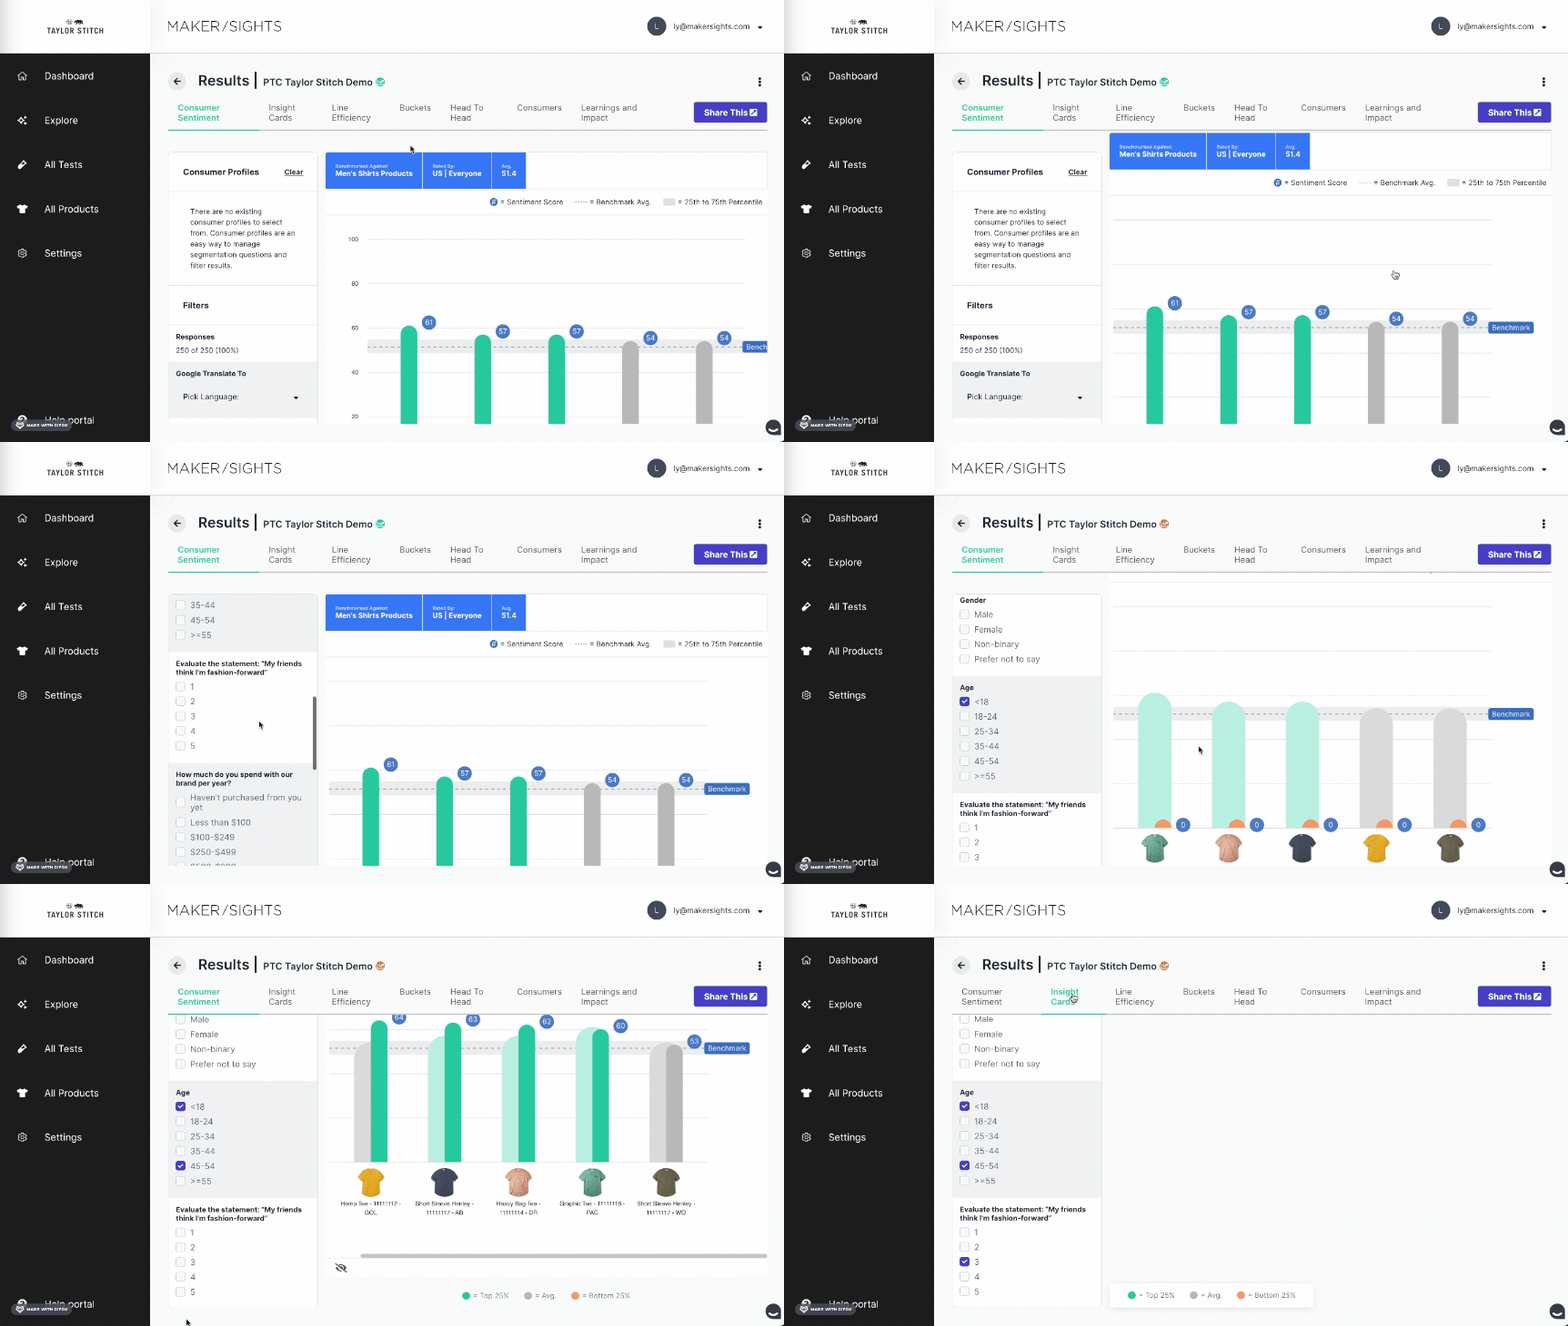
The team’s first assumption was that we needed better charts. In user sessions, the bigger problem was getting to them. Side navigation and filters took up most of the 1.0 screen, and results were organized by data category, which didn’t match how anyone read a report.
Leading design on a team of three
I led design over ten months with Lena, our UX researcher, and Vasyl, our design system designer. I ran user sessions and impact and effort workshops to work out what should ship in what order.
We shipped parity first, starting with filters, sentiment score and line efficiency, so customers could move to 2.0 without losing what they relied on. New features came after that.
Survey Results 2.0
Navigation that follows the report
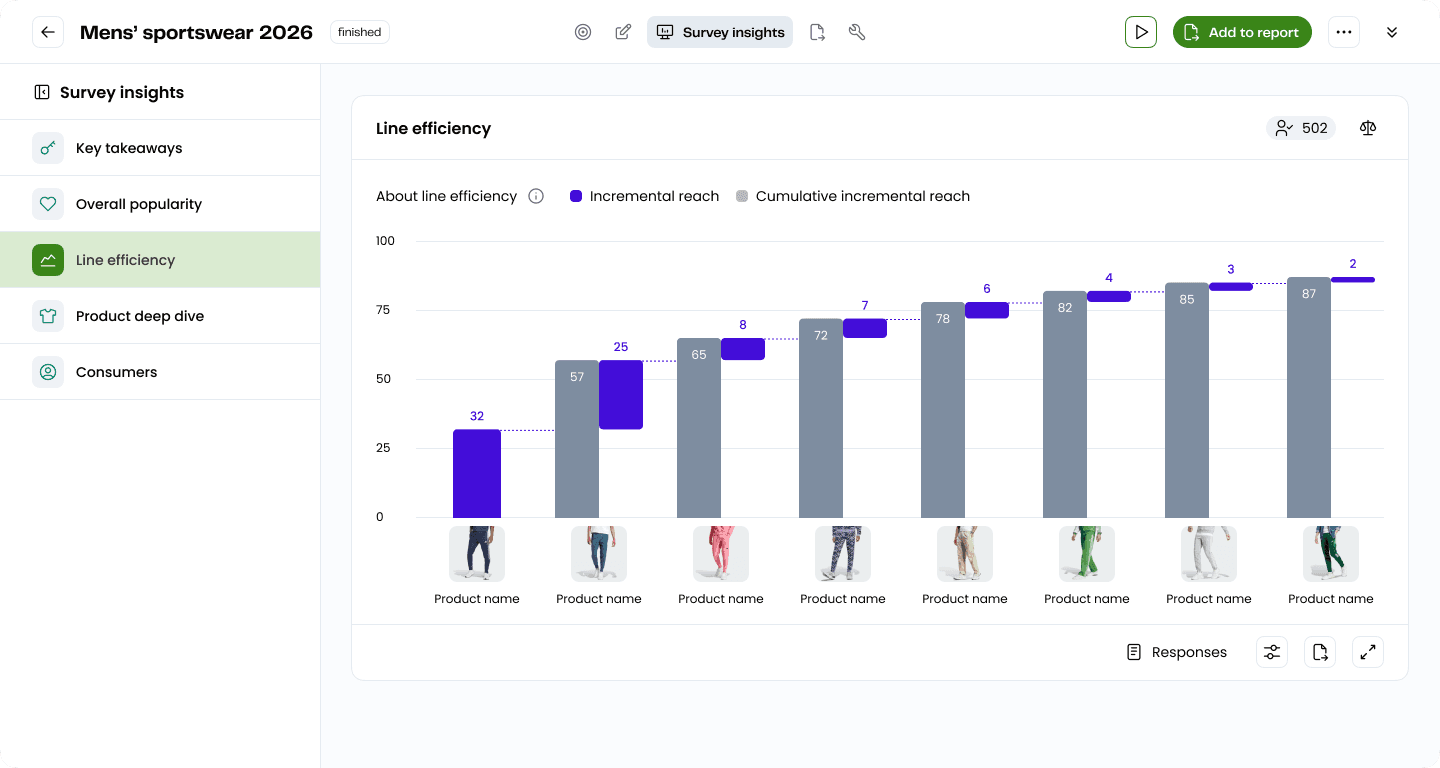
I pushed to reorganize results around the sections Customer Ops was already building into decks: Key takeaways, Overall popularity, Line efficiency, Product deep dive and Consumers. This made the biggest difference to how quickly people found what they needed.
Comparing inside the product
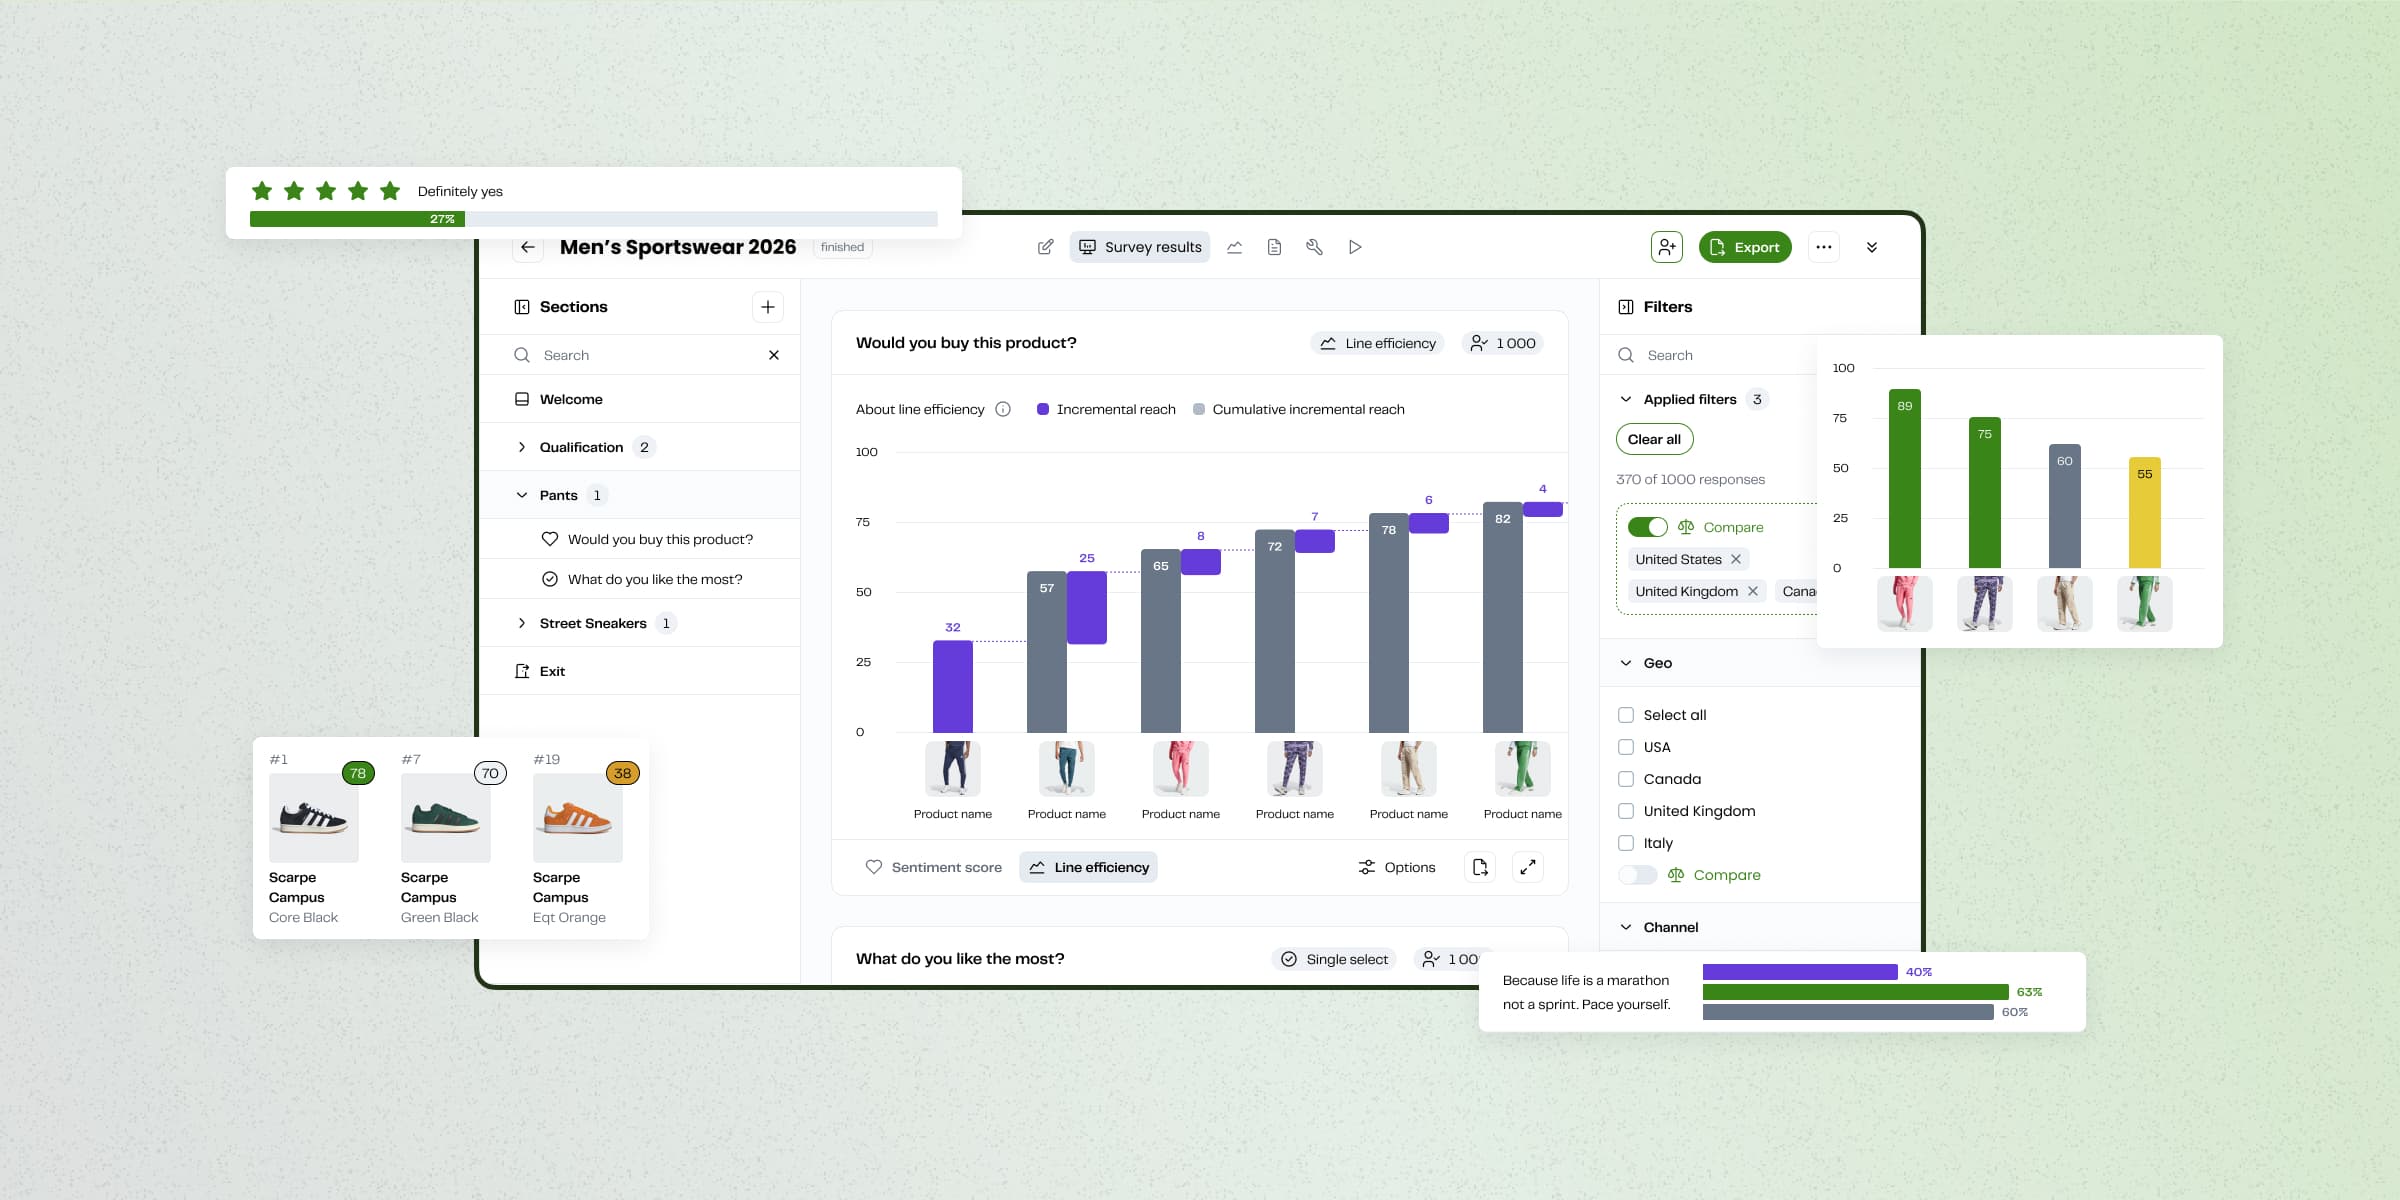
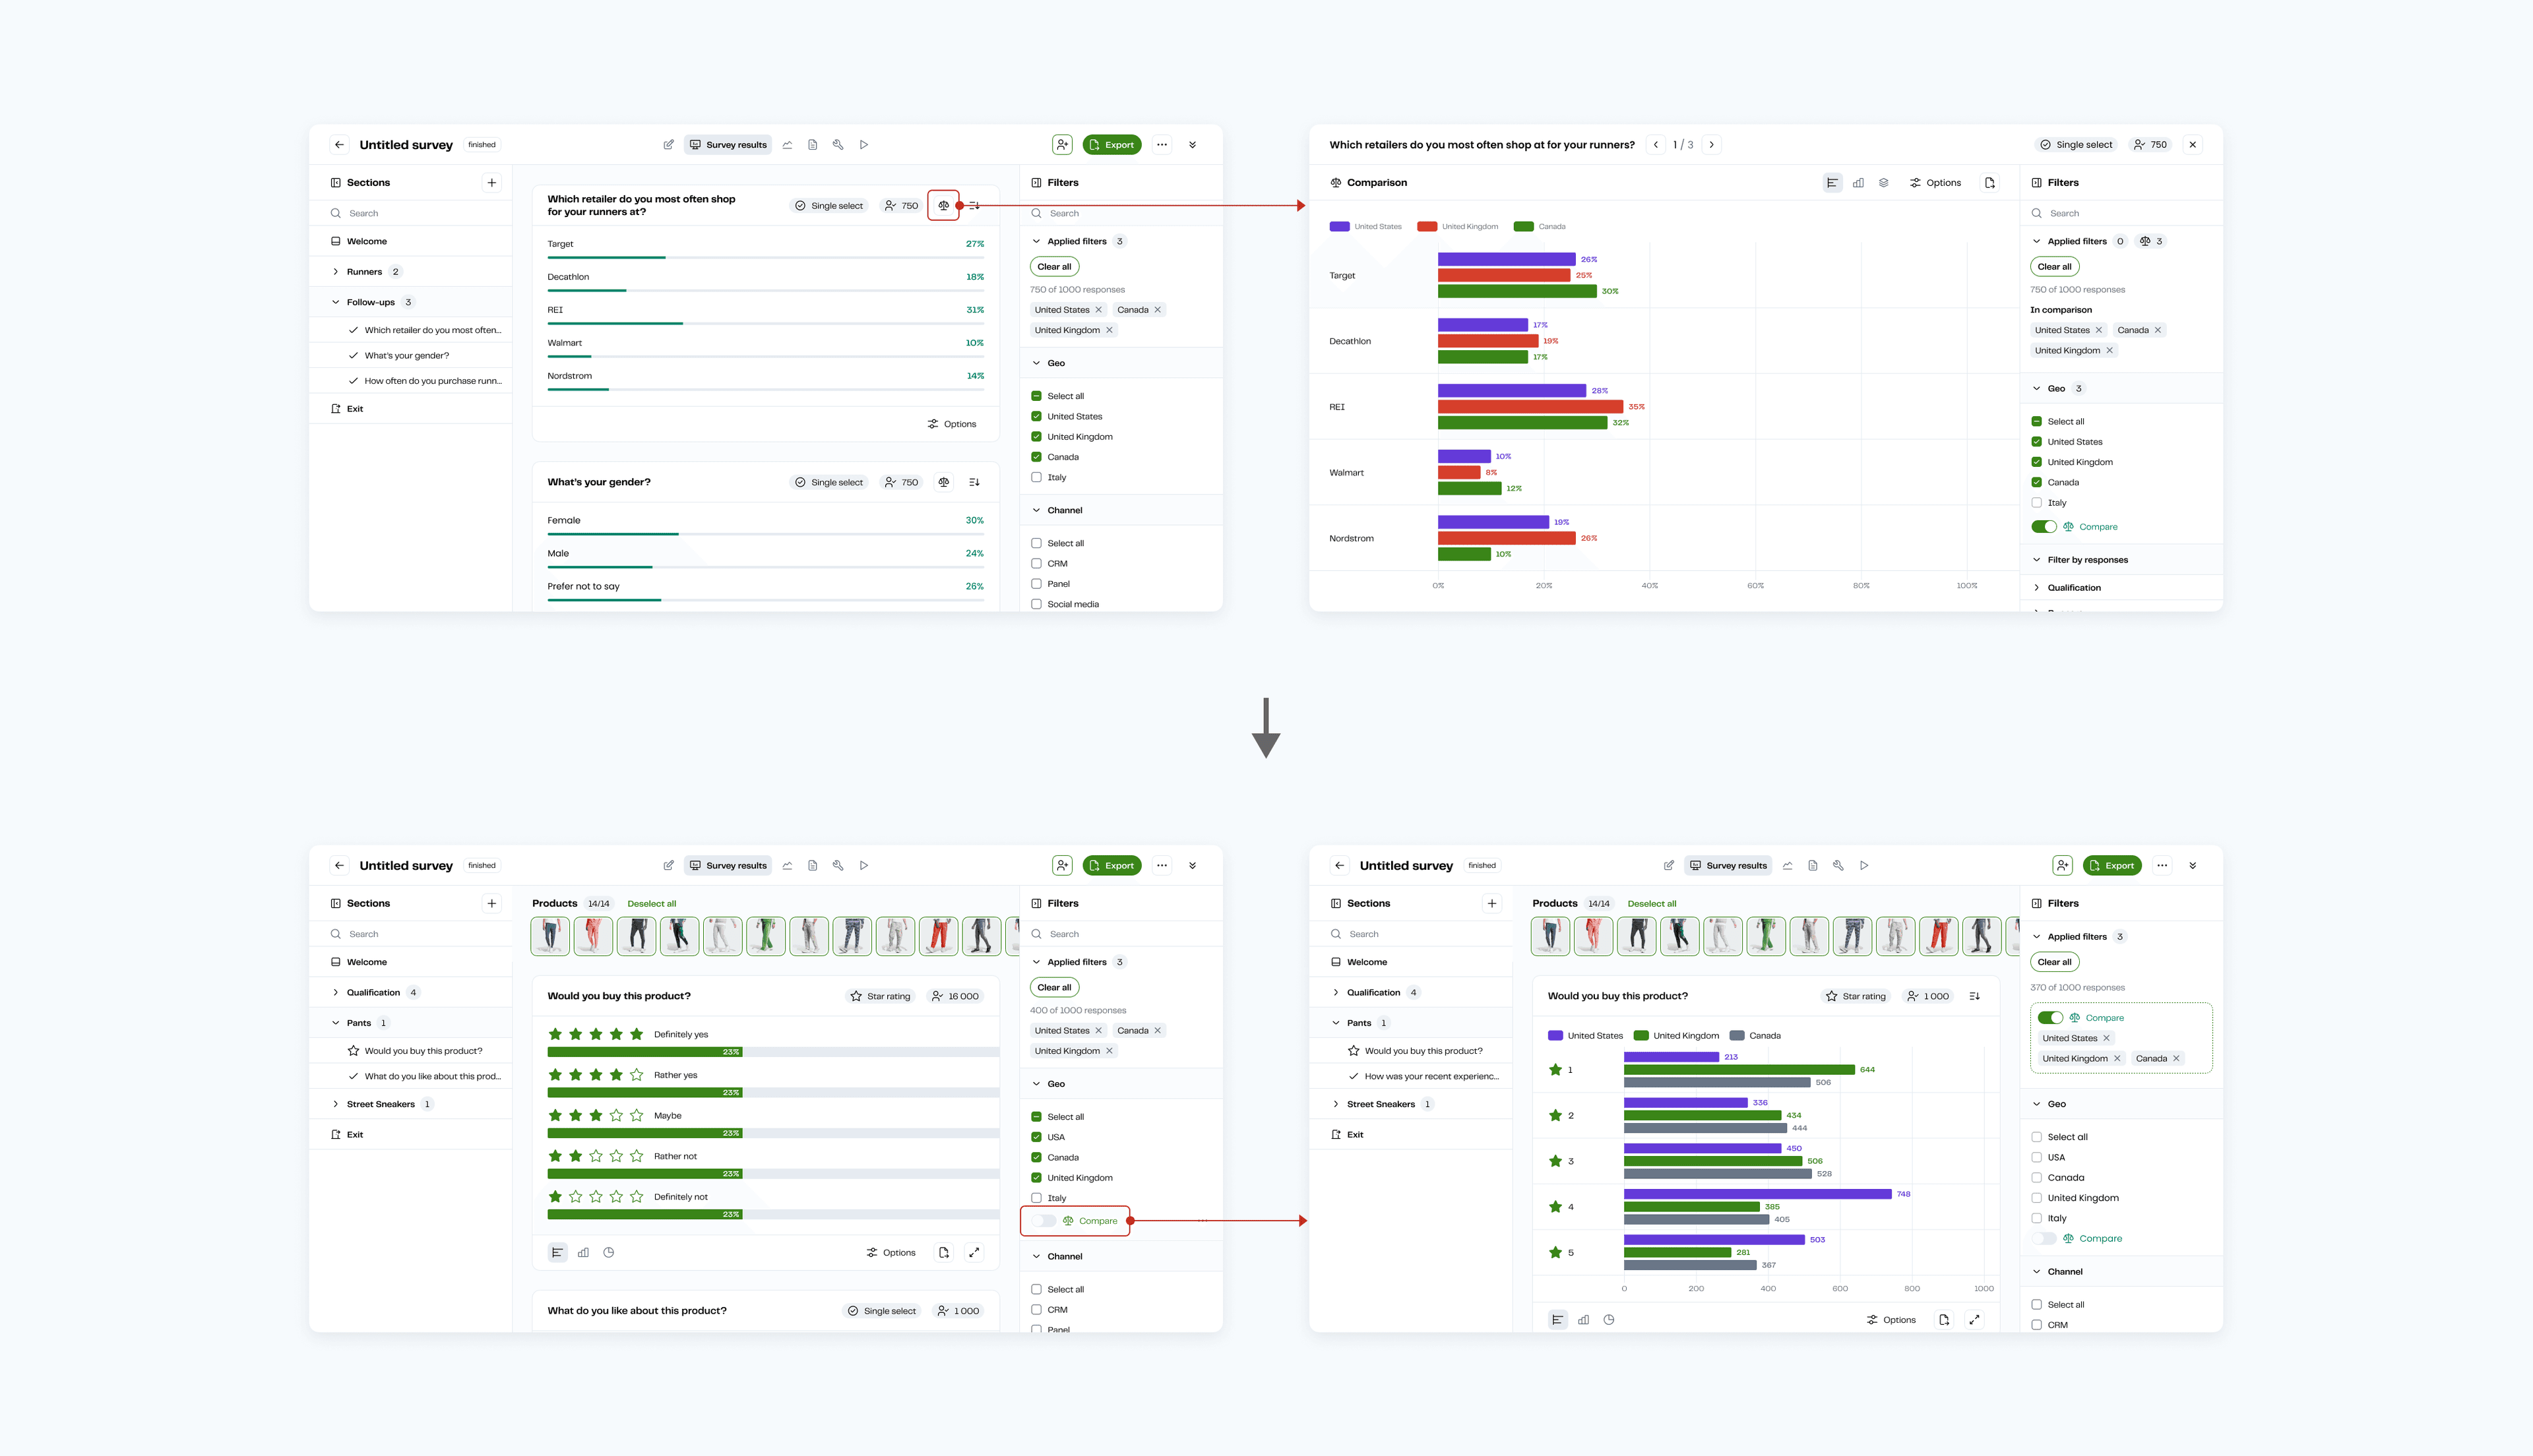
Comparing segments used to mean exporting to Excel and copying a table into a deck. My first version opened a comparison on its own page, which pulled people out of what they were reading. After testing with Lena, we shipped a Compare toggle in the filters panel that applies to every question at once.
More room for the charts
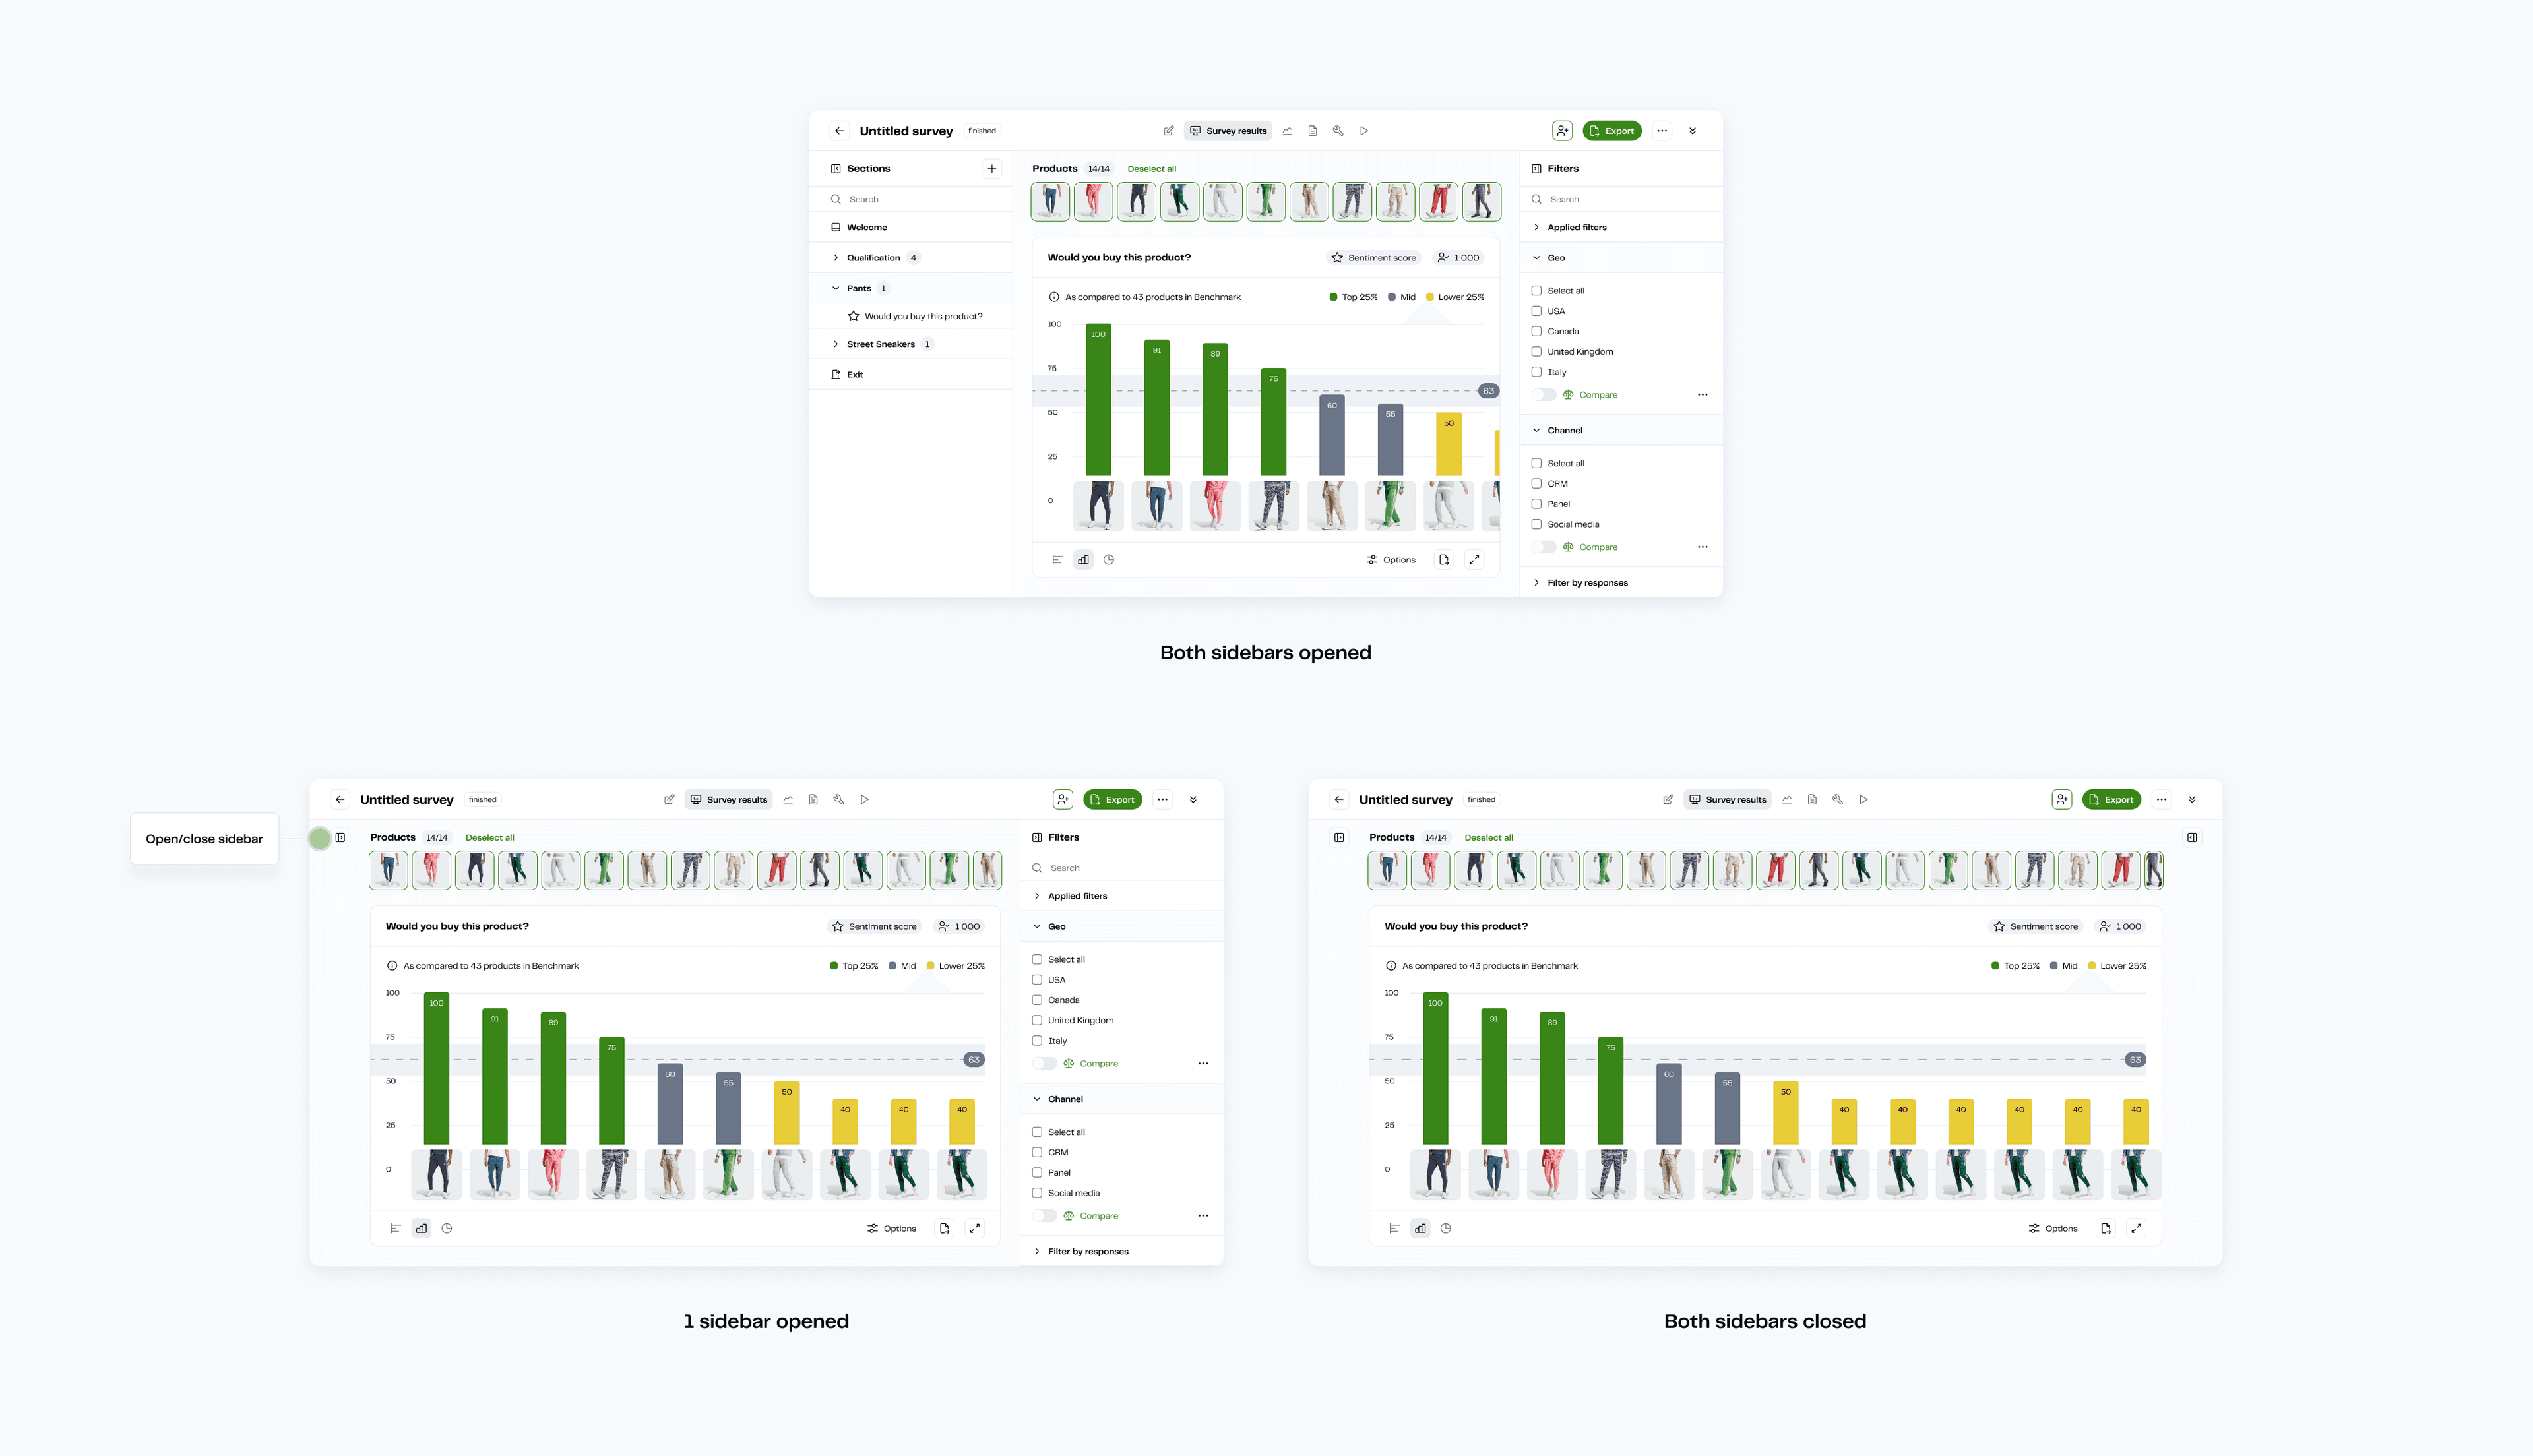
1.0 supported three question types with one chart option, and 2.0 grew that to ten question types and five chart styles. Most surveys had at least 15 products, so I made both sidebars collapsible and added a full-screen mode to keep them all in view.
Products you can scan
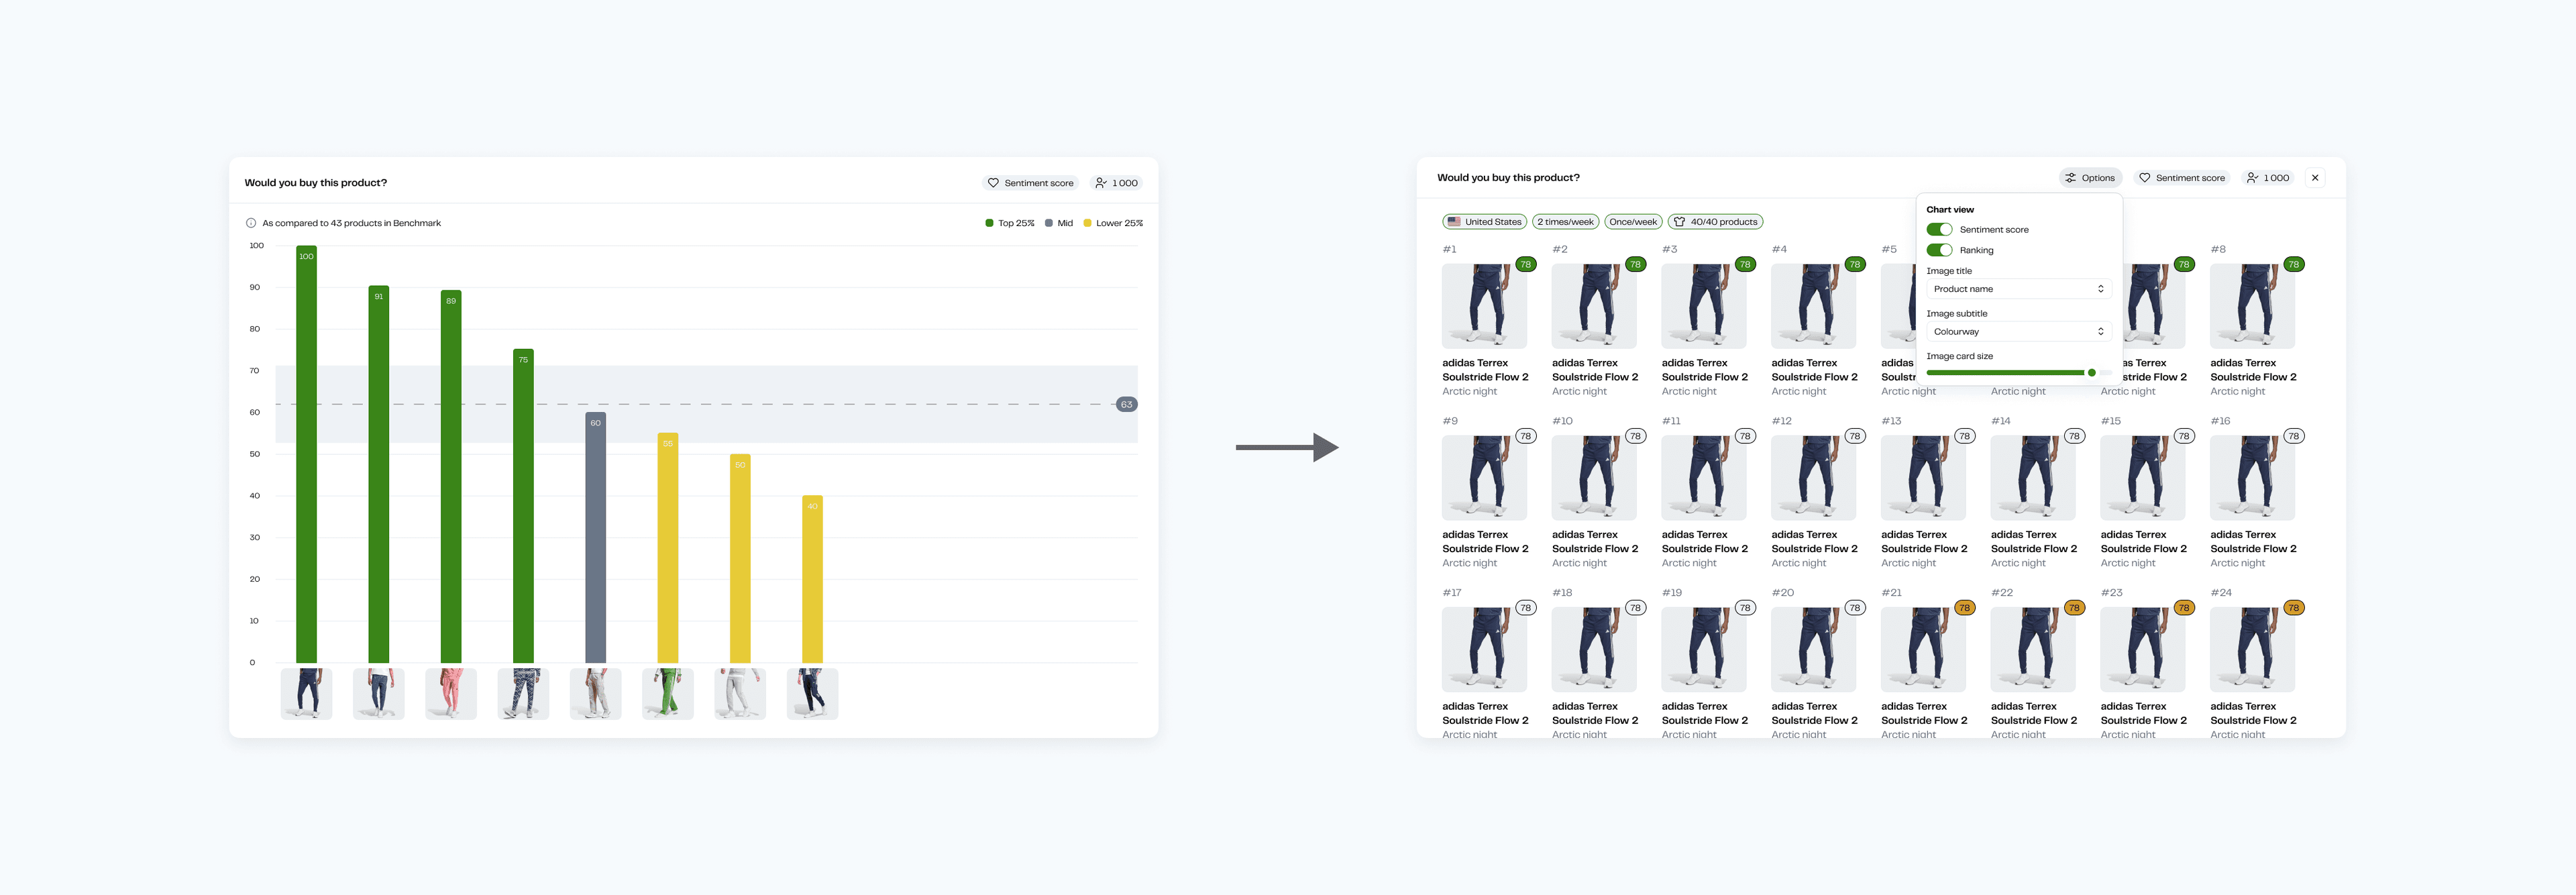
In my regular conversations with Customer Ops, I heard that customers cared more about seeing the products than about another chart. Merchandising teams were screenshotting charts and annotating them in slides. So I added a view that ranks up to 40 product tiles by sentiment score, with a control for tile size.
Summaries of open-text answers
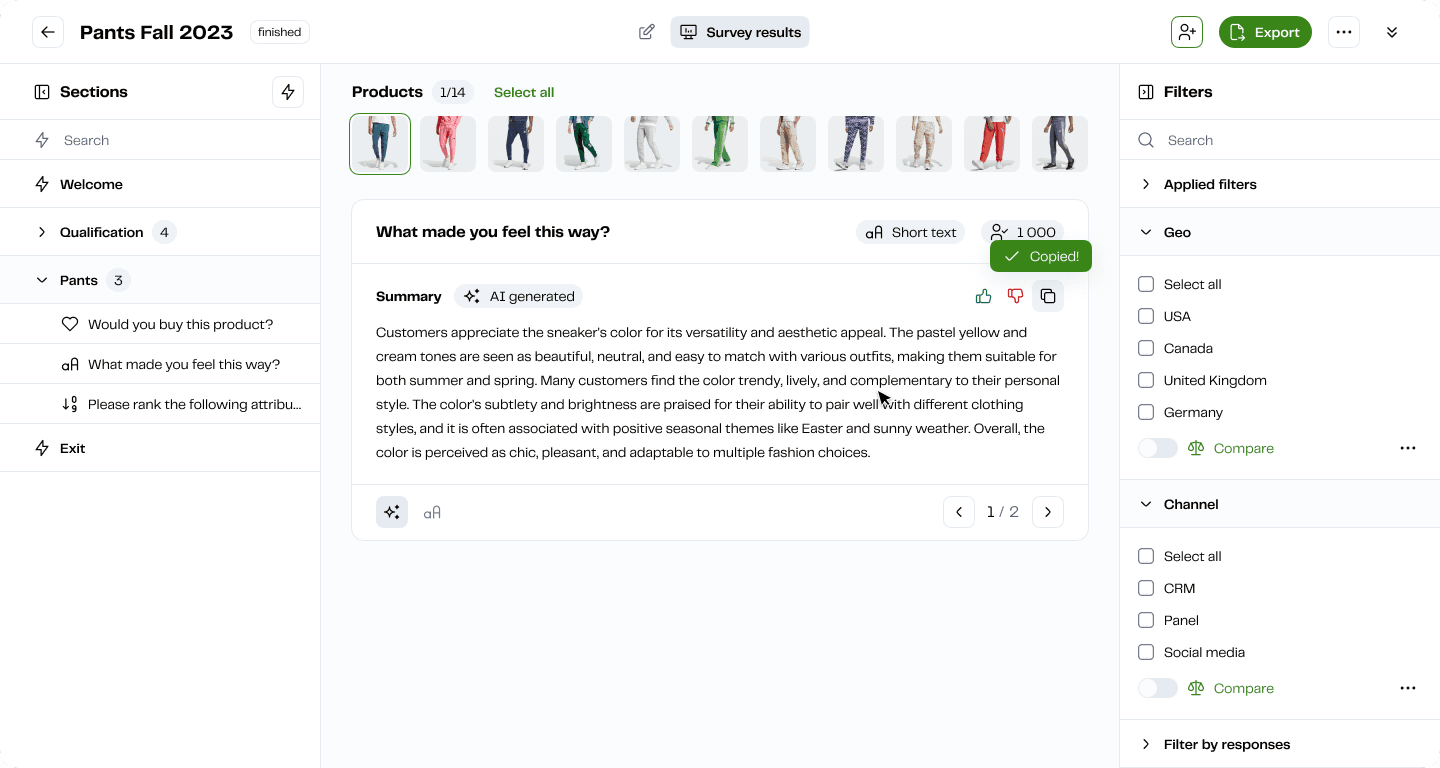
Open-text answers were some of the most useful data brands had, and reading through thousands of them took hours. We added AI summaries that people could copy, rate or regenerate. The team expected this to save time, and it did. What surprised us was that teams could use a summary directly, because its structure matched the client deck.
Decks in under an hour
Customer Ops could analyze a study and build the deck in under an hour, which gave them time back for analysis. Several 2.0 features came up by name in renewal calls.
What I’d do differently
New users picked up the navigation quickly. People with muscle memory from the old tabs needed more guidance than the interface gave them. We knew onboarding was a gap and didn’t get to it in this scope. Next time I’d push to do it in the same phase as the navigation.
People were doing a lot of work around the product without ever complaining about it: screenshots annotated in slides, pivot tables, comparisons copied into decks. Finding those was the most useful part of the research, and none of them had shown up as a request.